Your Accounts Are Telling
You Everything.
You're Hearing Almost None of It.
GPU utilization is dropping at three accounts. A champion went silent two weeks ago. A competitor just started a POC at your biggest renewal. Your CS team finds out at the QBR — eight weeks too late.
CS Pulse listens to every operational signal across every account — and turns them into actions, playbooks, and revenue outcomes. Purpose-built for AI chip companies, server OEMs, and data center infrastructure.
Every Vertical Has
Different Priorities
AI chip companies watch GPU utilization. Server OEMs obsess over deployment velocity. Data centers track capacity trajectory. CS Pulse adapts its health model to your vertical — and recalibrates monthly from your actual outcomes.
Go Live With 5 KPIs.
Build Out as You Learn.
No rip-and-replace. No 6-month implementation. Pick the KPIs that matter most to your team today. Enable more pillars as you mature. The platform works with what you give it — and gets smarter over time.

Start Where You Are
Pick 5 KPIs — say GPU Utilization, RMA Rate, Capacity Trend, Partner Engagement, Deployment Cycle Time. Enable just those pillars. Disable the rest. Your health model works immediately with whatever you have.
Flexible by Design
Pillar names, KPI labels, and weights are all configurable per customer. The KPI catalog has extension slots — add custom metrics as your team matures. Rename pillars to match your internal language.
MCP Tools Pull Your Data
If your data lives in backend systems, CS Pulse’s 21 MCP tools let Claude pull directly from Salesforce, ServiceNow, or your telemetry APIs. No ETL project. Ask Claude to fetch the data, and it does.
Pre-Packaged n8n Workflows
Prefer a UI? Drag-and-drop n8n workflows connect Google Sheets, Jira, Slack, and more to CS Pulse. Upload a CSV today; automate the flow tomorrow. No engineering team required.
Full REST API
For API-first teams: schema-validated CSV upload, automated customer provisioning, and onboarding automation. One API call provisions a complete customer environment end-to-end.
Weights Self-Optimize
Start with default weights. After 90 days of data, Wizard C recalibrates pillar and KPI weights from your actual expansion and churn outcomes. The model gets smarter as you add data — not before.
One Platform.
Your Whole Ecosystem.
Your VARs, SIs, and channel partners manage your accounts in spreadsheets. They don't see account health. You don't see their activities. QBRs happen in a black box. Co-selling opportunities are discovered by accident.

Share MCP Servers, Not Training
Partners connect to your CS Pulse MCP server through Claude. They ask questions in natural language: “Which accounts are at risk?” “What’s the expansion pipeline?” No training manuals. No new UI. Claude is the interface.
Partner-Grade Visibility
Partners see their accounts’ health scores, pillar breakdowns, and recommended actions — scoped to their portfolio. They don’t see your other customers or raw data. They see the intelligence layer.
Channel Health as a First-Class Pillar
P4 (Channel & Partner Health) tracks Partner Engagement, VAR Performance, Joint QBR Frequency, Co-selling Opportunities, and Partner NPS. It’s 15% of the health model because channel dysfunction is a leading churn indicator.
Cohesive Operating Rhythm
When CS Pulse detects a VAR inactive for 30+ days, it triggers the right playbook, assigns the CSM, and loops the partner into the recovery plan. Internal and external teams operate from the same intelligence.
From Signal to Action
In Hours, Not Quarters
This isn't a dashboard you check once a quarter. It's a daily operating system for your CS team — watching signals, detecting patterns, triggering playbooks, and proving outcomes.
Watch
38 KPIs across 5 pillars, monitored continuously for every account. Not vanity metrics — signals with proven correlation to expansion (0.92 for capacity trajectory) and churn.
Detect
When signals converge, CS Pulse recognizes the pattern. GPU utilization drops + champion disengages + QBR skipped isn’t three yellow flags — it’s the Silent Churn arc, and the platform has seen this before.
Act
The right playbook fires automatically. SLA Stabilizer for support crises. Expansion Timing for growth-ready accounts. Your CSM’s top-10 daily actions arrive prioritized by dollar impact with named ownership.
Prove
Every intervention builds a causal record: what signal triggered it, what action was taken, what revenue was protected or expanded. Not a dashboard — a body of evidence for the CFO.
Every Account Has a
Causal Chain.
Now You Can See It.
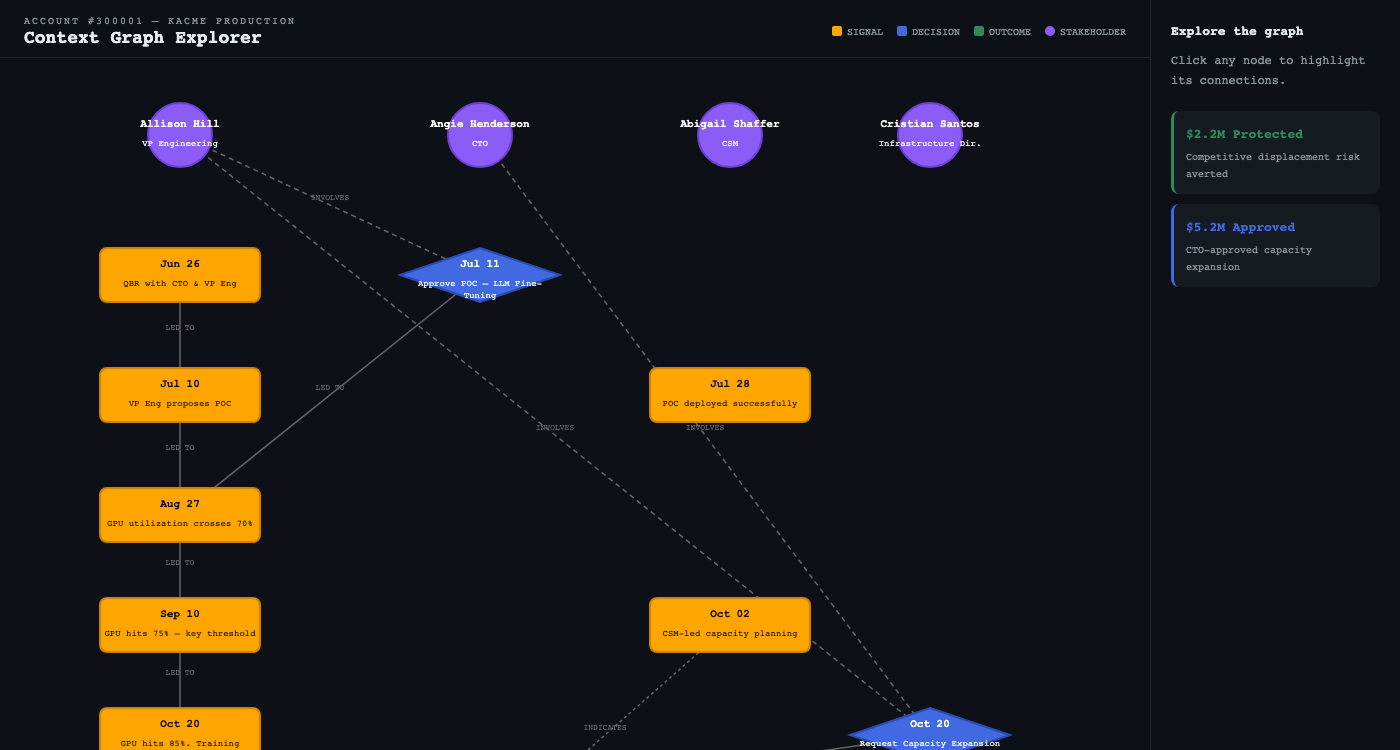
Every signal, decision, and outcome in an account is connected in a graph. Not a timeline — a causal model. Walk upstream to find root causes. Walk downstream to see revenue impact. Run what-if scenarios to justify intervention.
8 Revenue Narratives.
Battle-Tested.
Every account eventually follows one of these patterns. CS Pulse recognizes which story your account is living — and knows how it ends if you don't act.
Silent Churn
Account scores 78 — “Healthy.” But the champion went quiet, a QBR was skipped, and a competitor POC is running. Traditional tools miss it because the number is green.
Land & Expand
New customer lands at $1.2M for one rack. The platform tracks adoption velocity across three deployment phases and identifies expansion windows before the customer even budgets for them.
Crisis Recovery
Catastrophic cooling failure at a top-tier account. 40% of GPU nodes offline. The traditional response: war room, finger-pointing, 6-week recovery.
Enterprise-Grade
by Default
Not by upgrade tier, not by add-on. Every customer gets full data isolation, audit logging, and schema validation from day one.

Multi-Tenant Isolation
Every customer gets a UUID-isolated environment. Independent PostgreSQL schemas. Separate Qdrant vector collections. Not row-level filtering — actual data separation.
KPI Range Filters
Configurable thresholds and valid ranges per KPI prevent garbage data from corrupting health scores. Out-of-range measurements are flagged, not silently ingested.
Activity Logging
Every API call, data upload, configuration change, and user action is logged with timestamps, user identity, and resource context. Full audit trail.
Secure File Handling
Uploaded CSVs go through schema validation, directory isolation, and cleanup policies. No arbitrary file access across customer boundaries.
Role-Based Access Control
User-level permissions scoping what each team member can view, edit, and configure. CSMs see their accounts. Managers see the portfolio. Partners see their slice.
Session Security
Authentication via Flask-Login with session management, inactive account detection, and automatic session expiry. Activity timestamps on every request.
Full-Stack
Platform Capabilities
For the technical buyer: context graph causal chains, Power-of-1 revenue modeling, Claude MCP integration, and a self-optimizing weight pipeline. The full post-sale intelligence lifecycle.
Context Graph Intelligence
Signal → Decision → Outcome causal chains across every account. 8 story arcs map real revenue narratives — from silent churn to expansion champion.
21 MCP Tools via Claude
Account health, revenue at risk, causal chains, ROI stories, CSM actions — all queryable through natural language. Claude becomes your revenue intelligence analyst.
Power-of-1 Revenue Model
Calculate the revenue impact of a 1% improvement in any business metric — NRR, GRR, expansion rate, TTFV. Connects operational KPIs to dollar outcomes.
ROI Engine & Portfolio Story
Historical proof of value delivered + forward projections + bridging narrative. Per-account and portfolio-level ROI stories with trajectory assessment.
Signal Analyst Agent
AI agent combining 38 KPIs from PostgreSQL with qualitative signals from Qdrant into health recommendations with early-warning flags.
Playbook Orchestration
5 trigger-based playbooks with severity routing. VoC Sprint, Activation Blitz, SLA Stabilizer, Renewal Safeguard, Expansion Timing — each with named CSM owner.
Wizard A / B / C Pipeline
Journey Generator, Pattern Analyzer, and Weight Optimizer run on onboarding and monthly recalibration. Weights converge to your actual outcomes.
Multi-Tenant Architecture
UUID-based fully isolated customer environments. Independent Qdrant collections and PostgreSQL schemas. Zero cross-tenant data exposure.
Health Score Architecture
21 MCP Tools — Ask Claude Anything
Raw Data to Revenue Intelligence
Ingest & Provision
Upload 15 CSV types or connect via Claude MCP. API validates schema, loads PostgreSQL, builds Qdrant embeddings, ingests context graph.
Context Graph Build
9 CSV types map Signal → Decision → Outcome chains per account. Stakeholders, events, decisions, and outcomes connected causally.
Wizard A — Journey Generator
Transforms raw data into 12-month account journey timelines with health arcs, milestones, and phase transitions.
Wizard B — Pattern Analyzer
Detects expansion, churn, and recovery trajectories. Maps to 8 story arcs. Auto-generates early warning rules.
Wizard C — Weight Optimizer
Learns which KPIs predict outcomes in your data. L1/L2 weights recalibrate monthly from actual results.
Revenue Intelligence
Power-of-1 modeling, ROI stories, portfolio revenue at risk, and CSM daily actions. Monthly cadence, full explainability.
Customer Success Dashboard
Built by a
Practitioner,
Not a Lab
Founded by Manoj Gupta — 25 years of enterprise technology leadership across Oracle, IBM, Accenture, and DXC. CS Pulse was built from direct experience in the gap between dashboards that look good and intelligence that actually prevents churn and drives expansion.

See Your Accounts
Through CS Pulse
Bring your data or use ours. Account health scoring, expansion readiness analysis, and revenue intelligence in 2 weeks. No rip-and-replace. No commitment.